
Advertisement
-
Published Date
April 30, 2025This ad was originally published on this date and may contain an offer that is no longer valid. To learn more about this business and its most recent offers, click here.
Ad Text
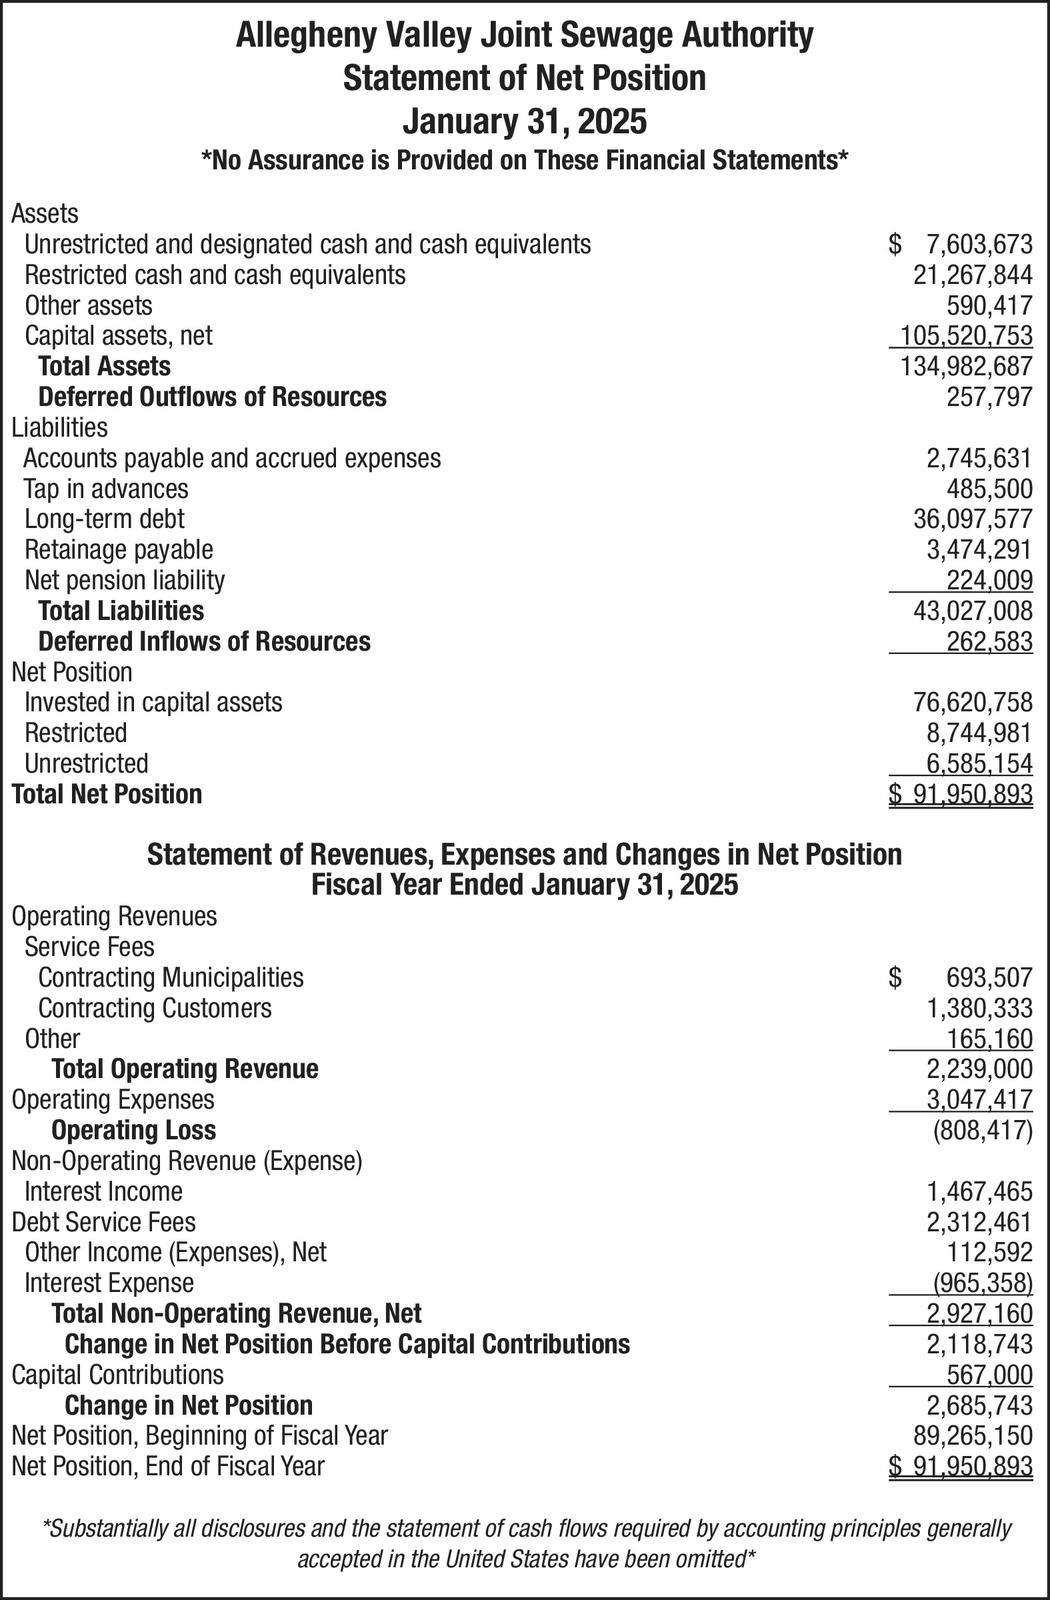
Allegheny Valley Joint Sewage Authority Statement of Net Position January 31, 2025 *No Assurance is Provided on These Financial Statements* Assets Unrestricted and designated cash and cash equivalents Restricted cash and cash equivalents Other assets Capital assets, net Total Assets Deferred Outflows of Resources Liabilities Accounts payable and accrued expenses Tap in advances Long-term debt Retainage payable Net pension liability Total Liabilities Deferred Inflows of Resources Net Position Invested in capital assets $ 7,603,673 21,267,844 590,417 105,520,753 134,982,687 257,797 2,745,631 485,500 36,097,577 3,474,291 224,009 43,027,008 262,583 76,620,758 Restricted Unrestricted Total Net Position 8,744,981 6,585,154 $ 91,950,893 Statement of Revenues, Expenses and Changes in Net Position Fiscal Year Ended January 31, 2025 Operating Revenues Service Fees Contracting Municipalities Contracting Customers Other Total Operating Revenue Operating Expenses Operating Loss Non-Operating Revenue (Expense) Interest Income Debt Service Fees Other Income (Expenses), Net Interest Expense Total Non-Operating Revenue, Net Change in Net Position Before Capital Contributions Capital Contributions Change in Net Position Net Position, Beginning of Fiscal Year Net Position, End of Fiscal Year 693,507 1,380,333 165,160 2,239,000 3,047,417 (808,417) 1,467,465 2,312,461 112,592 (965,358) 2,927,160 2,118,743 567,000 2,685,743 89,265,150 $ 91,950,893 *Substantially all disclosures and the statement of cash flows required by accounting principles generally accepted in the United States have been omitted* Allegheny Valley Joint Sewage Authority Statement of Net Position January 31 , 2025 * No Assurance is Provided on These Financial Statements * Assets Unrestricted and designated cash and cash equivalents Restricted cash and cash equivalents Other assets Capital assets , net Total Assets Deferred Outflows of Resources Liabilities Accounts payable and accrued expenses Tap in advances Long - term debt Retainage payable Net pension liability Total Liabilities Deferred Inflows of Resources Net Position Invested in capital assets $ 7,603,673 21,267,844 590,417 105,520,753 134,982,687 257,797 2,745,631 485,500 36,097,577 3,474,291 224,009 43,027,008 262,583 76,620,758 Restricted Unrestricted Total Net Position 8,744,981 6,585,154 $ 91,950,893 Statement of Revenues , Expenses and Changes in Net Position Fiscal Year Ended January 31 , 2025 Operating Revenues Service Fees Contracting Municipalities Contracting Customers Other Total Operating Revenue Operating Expenses Operating Loss Non - Operating Revenue ( Expense ) Interest Income Debt Service Fees Other Income ( Expenses ) , Net Interest Expense Total Non - Operating Revenue , Net Change in Net Position Before Capital Contributions Capital Contributions Change in Net Position Net Position , Beginning of Fiscal Year Net Position , End of Fiscal Year 693,507 1,380,333 165,160 2,239,000 3,047,417 ( 808,417 ) 1,467,465 2,312,461 112,592 ( 965,358 ) 2,927,160 2,118,743 567,000 2,685,743 89,265,150 $ 91,950,893 * Substantially all disclosures and the statement of cash flows required by accounting principles generally accepted in the United States have been omitted *