
Advertisement
-
Published Date
August 15, 2024This ad was originally published on this date and may contain an offer that is no longer valid. To learn more about this business and its most recent offers, click here.
Ad Text
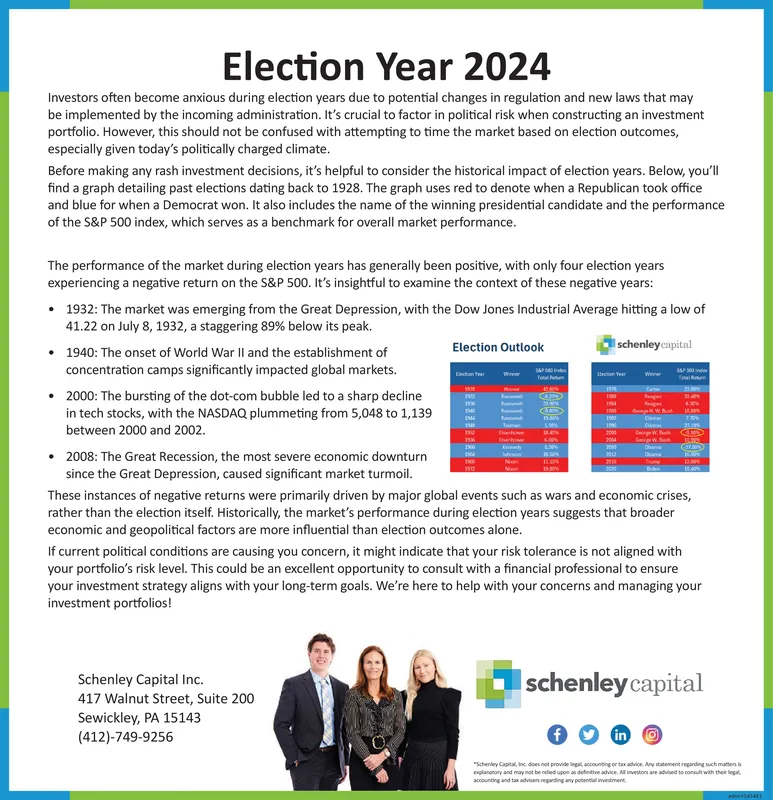
Election Year 2024 Investors often become anxious during election years due to potential changes in regulation and new laws that may be implemented by the incoming administration. It's crucial to factor in political risk when constructing an investment portfolio. However, this should not be confused with attempting to time the market based on election outcomes, especially given today's politically charged climate. Before making any rash investment decisions, it's helpful to consider the historical impact of election years. Below, you'll find a graph detailing past elections dating back to 1928. The graph uses red to denote when a Republican took office and blue for when a Democrat won. It also includes the name of the winning presidential candidate and the performance of the S&P 500 index, which serves as a benchmark for overall market performance. The performance of the market during election years has generally been positive, with only four election years experiencing a negative return on the S&P 500. It's insightful to examine the context of these negative years: 1932: The market was emerging from the Great Depression, with the Dow Jones Industrial Average hitting a low of 41.22 on July 8, 1932, a staggering 89% below its peak. 1940: The onset of World War II and the establishment of concentration camps significantly impacted global markets. 2000: The bursting of the dot-com bubble led to a sharp decline in tech stocks, with the NASDAQ plummeting from 5,048 to 1,139 between 2000 and 2002. Election Outlook Election Year schenleycapital Winner Case George W. Bu 15 1.70% Taman 199 Con Dirge W. Bush 2004 Denge W. Bush Obama $6.50% Obama 2016 Trump 12.00% 2008: The Great Recession, the most severe economic downturn since the Great Depression, caused significant market turmoil. These instances of negative returns were primarily driven by major global events such as wars and economic crises, rather than the election itself. Historically, the market's performance during election years suggests that broader economic and geopolitical factors are more influential than election outcomes alone. If current political conditions are causing you concern, it might indicate that your risk tolerance is not aligned with your portfolio's risk level. This could be an excellent opportunity to consult with a financial professional to ensure your investment strategy aligns with your long-term goals. We're here to help with your concerns and managing your investment portfolios! Schenley Capital Inc. 417 Walnut Street, Suite 200 Sewickley, PA 15143 (412)-749-9256 schenley capital in "Schenley Capital, Inc. does not provide legal, accounting or tax advice. Any statement regarding such matters explanatory and may not be relied upon as definitive advice. All investors are advised to consult with their legal accounting and tax advisers regarding any potential investment ad-343451 Election Year 2024 Investors often become anxious during election years due to potential changes in regulation and new laws that may be implemented by the incoming administration . It's crucial to factor in political risk when constructing an investment portfolio . However , this should not be confused with attempting to time the market based on election outcomes , especially given today's politically charged climate . Before making any rash investment decisions , it's helpful to consider the historical impact of election years . Below , you'll find a graph detailing past elections dating back to 1928. The graph uses red to denote when a Republican took office and blue for when a Democrat won . It also includes the name of the winning presidential candidate and the performance of the S & P 500 index , which serves as a benchmark for overall market performance . The performance of the market during election years has generally been positive , with only four election years experiencing a negative return on the S & P 500. It's insightful to examine the context of these negative years : 1932 : The market was emerging from the Great Depression , with the Dow Jones Industrial Average hitting a low of 41.22 on July 8 , 1932 , a staggering 89 % below its peak . 1940 : The onset of World War II and the establishment of concentration camps significantly impacted global markets . 2000 : The bursting of the dot - com bubble led to a sharp decline in tech stocks , with the NASDAQ plummeting from 5,048 to 1,139 between 2000 and 2002 . Election Outlook Election Year schenleycapital Winner Case George W. Bu 15 1.70 % Taman 199 Con Dirge W. Bush 2004 Denge W. Bush Obama $ 6.50 % Obama 2016 Trump 12.00 % 2008 : The Great Recession , the most severe economic downturn since the Great Depression , caused significant market turmoil . These instances of negative returns were primarily driven by major global events such as wars and economic crises , rather than the election itself . Historically , the market's performance during election years suggests that broader economic and geopolitical factors are more influential than election outcomes alone . If current political conditions are causing you concern , it might indicate that your risk tolerance is not aligned with your portfolio's risk level . This could be an excellent opportunity to consult with a financial professional to ensure your investment strategy aligns with your long - term goals . We're here to help with your concerns and managing your investment portfolios ! Schenley Capital Inc. 417 Walnut Street , Suite 200 Sewickley , PA 15143 ( 412 ) -749-9256 schenley capital in " Schenley Capital , Inc. does not provide legal , accounting or tax advice . Any statement regarding such matters explanatory and may not be relied upon as definitive advice . All investors are advised to consult with their legal accounting and tax advisers regarding any potential investment ad - 343451